Grid: Enable Summaries
Summary functions including count, sum, average, etc. are available on grids to allow for easy calculations of the data in the rows. These are commonly used on grids displaying financial data.
To use these features:
1. Select View on the grid's toolbar and Enable Summaries from the menu.
2. The summary icon  will display on each of the column headers.
3. Click on the summary icon on the column to summarize. This may be done for as many columns as needed.
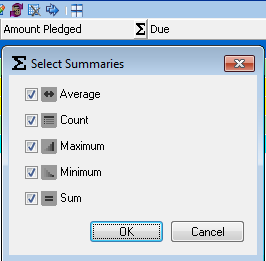
The Select Summaries window will display.

Not all options may be available for all columns, depending on the data type. Average and Sum features are enabled for numeric columns.
- Average
- Count -
- Maximum -
- Minimum
- Sum
 |
NOTE:
If a filter is set, only the displayed records will be included in the summary. |
4. Select the functions from the list to display for that column and click OK.
5. The summary functions will display under the column(s) selected.

6. To remove the summaries, select View on the grid's toolbar and Enable Summaries from the menu. Uncheck the summary options and click OK.
7. To hide the summary icon on the header, select View on the toolbar and uncheck the Enable Summaries option from the menu.


